When 60 million Christians began to gave up in-person worship on Streaming Sunday, they helped slow the growth of Covid-19. Although there is tremendous economic loss in the Stay-at-Home orders, this helped reduce the growing crisis in thousands of homes and the nation’s hospitals. It took 10 days of implementation for the effects of these measures to be realized.
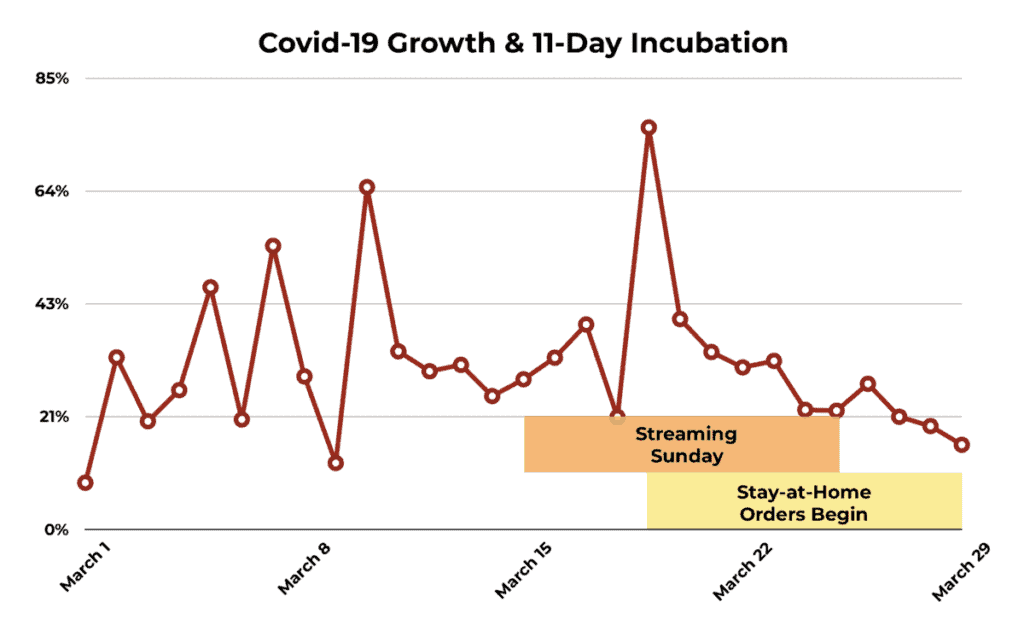
Streaming Sunday began on March 15. On that day approximately 90% of American churches began streaming their worship services to 60 million congregants. Many states began Stay-at-Home orders on or about March 19. Within the 11.2 maximum incubation period of Covid-19, the daily growth slowed to 22% on March 25 and then 16% on March 29. In simpler terms, after Streaming Sunday and Stay-at-Home, it took about 10 days to realize a decline in the daily growth rate.
Another way to look at the complex numbers is that the average daily rate of growth from March 1 to March 23 was 34%. From March 24 to March 29, the average daily growth was 23%.
The data shows a downward trend of 11% in the percent of growth of Covid-19 cases. This is encouraging. The data shows that both Streaming Sunday and Stay-at-Home orders are slowing the rapid growth of Covid-19. If Americans continue social distancing, the daily growth may continue its decline. It may be possible for churches to reopen their campuses in May.
The story in not finished. The data as of March 29 demonstrates that both Streaming Sunday and Stay-at-Home measures are working. The upcoming weeks will show the continued efficacy of the procedures.
If Americans continue social distancing, we may see a significant decline and ultimate zero growth of Covid-19. This may happen by Easter, April 12 or by the end of April. Church may be able to have live services in May.
The challenge is enormous. With the current measures, the war on Covid-19 may have seen its turning point.
Data and the Future
The following material is data-centric, so be forewarned that it can be technical.
Streaming Sunday
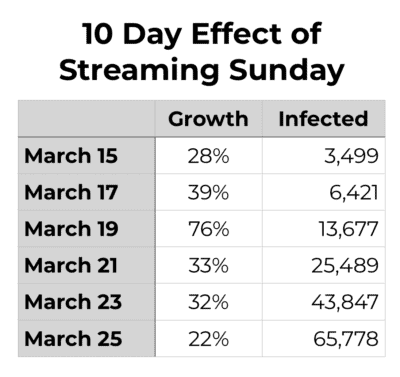
The numerical growth of Covid-19 was dramatic. On Streaming Sunday there was a 28% daily growth and two days later the highest-to-date daily growth was 76%.
The number of those infected doubled every 3 days, rising from 3,499 on March 15 to 43,847 on March 23. Ten days after Streaming Sunday, on March 25, the rate of daily growth slowed to 22%. It took 10 days to see the full effects of Streaming Sunday.
Stay-at-Home
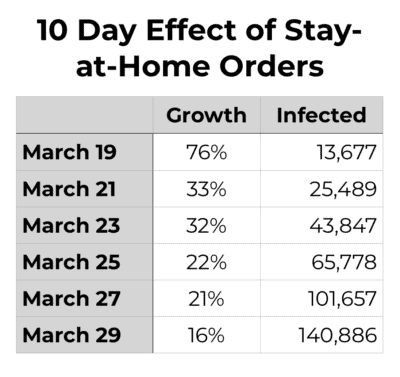
Many states began to implement Stay-at-Home orders on or about March 19, when the day of maximum daily growth occurred at 76%. By March 29, the rate of daily growth of Covid-19 fell to 16%. It took 10 days to see the full effects of the Stay-at-Home orders.
From March 19 to March 27, the total of those infected doubled every 4.4 days, rising from 13,677 on March 19 to 101,657 on March 27. On March 29, the growth rate significantly slowed to 16%. The doubling rate had slowed to every 6 days.
Without Any Measures?
The scenarios without Streaming Sunday or Stay-at-Home orders is bleak. As of March 29, hospitals and intensive care units in New York and New Orleans are overloaded. The number of ventilators is limited. Looking at the future, if Covid-19 grew at the highest daily average 34% or the lower 21% average, hospitals in every part of the nation could not effectively treat the large number of patients.
If 34% Growth Continued
At the 34% average daily growth rate, 14.5 million Americans would be infected. 2,300,000 cases would require hospitalization, greatly overwhelming the nation’s 960,000 hospital beds, not taking into account the limited supply of Personal Protective Equipment (PPE) and ventilators. Over 250,000 people would die.
If 21% Growth Continued
At the 21% average daily growth rate, 2.2 million Americans would be infected. 350,000 cases would have required hospitalization, greatly overwhelming the nation’s intensive care units. Over 39,000 people would die.
Slower Growth Rates
If the rate of growth continues to slow, becoming 8% by Easter, April 12, the total cases could be 575,000. Over 82,000 cases would require hospitalization and 9,700 could perish.
It is possible that the average daily growth could be even lower or zero by Easter. If that happened, the 11.2 day maximum incubation period would continue to call for limited gatherings until the end of April. Churches may be able to reopen their facilities in May.
Data
Covid-19 data is from the Coronavirus COVID-19 Global Cases by the Center for Systems Science and Engineering (CSSE) at Johns Hopkins University (JHU): https://www.arcgis.com/apps/opsdashboard/index.html#/bda7594740fd40299423467b48e9ecf6
Raw data on the number of cases can be found at: https://github.com/CSSEGISandData/COVID-19/blob/master/csse_covid_19_data/csse_covid_19_time_series/time_series_covid19_confirmed_global.csv
Raw data on mortality can be found at: https://github.com/CSSEGISandData/COVID-19/blob/master/csse_covid_19_data/csse_covid_19_time_series/time_series_covid19_deaths_global.csv

