
XPastor gives away a 35 page Compensation Study when a church puts the Salary Forecaster over a billion dollar mark. In July of 2024, at the $2 billion mark, it went to a church in North Carolina; in June 2025, at the $3 billion mark, to a church in Indiana; and in April 2026, at the $4 billion mark, to a church in Colorado.
It’s our way of saying thank you for contributing to the Salary Forecaster!
2027 Salary Forecaster. Now over $4.0 billion
This is the largest free church salary database that we know of—even one of the largest of all church salary databases, and it is free. Gain insights into fair Compensation.
Easily Compare Data
Find churches in your region of a similar size. Compare those salaries to your church. See the relative salary differences between top management and staff. The salaries include base salary plus housing. The worship size is the average worship attendance per Sunday in each church. The data is sorted into the four census regions of the United States—midwest, northeast, south and west.
It is amazing that the range of annual budget sizes and salaries in churches with 900-1,050 in attendance. The summary data is extremely helpful for our Administrative Team. —DH
As someone that did something similar for over 20 years with large churches, I think the Salary Forecaster is well done. —Dave
It began at the first XP-Seminar in 2005 with a grassroots effort for salary data. Within a few minutes, there were 60 salaries. The data now is so large as to give extremely strong statistical reliability. Church sizes range from 25 to 10,000+.
Around the country, salaries and benefits are 54.3% of church budgets. This area deserves your highest attention.
If you are wondering what to do with all the data in the Salary Forecaster, see the DIY. Boggled by all the data and the time it will take to create a salary study, Get Fletch’s Help. See common issues as Fletch Answers Salary & Forecaster Questions.
Two Easy Steps
-
When we receive your data, receive access to the Forecaster for 365 days.
Anonymity
All data is posted anonymously and your confidential information is secure. No city or state location data is shared. Titles are smoothed out for anonymity and easy comparison. For example the title, College Pastor to Harvard University, is changed to College Pastor/Director. Your anonymity is important and safeguarded. We use 57 titles in our published data.
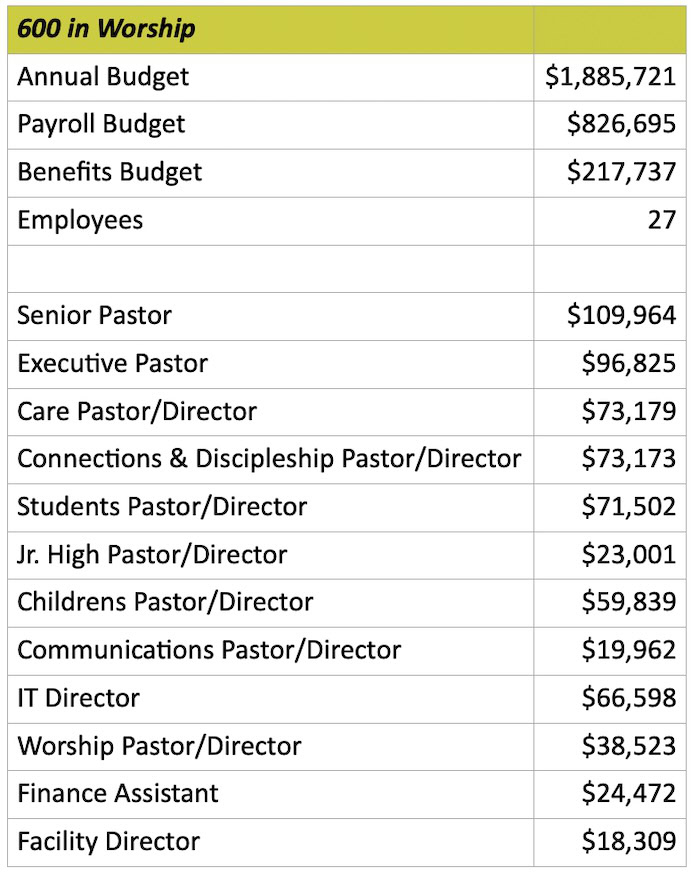
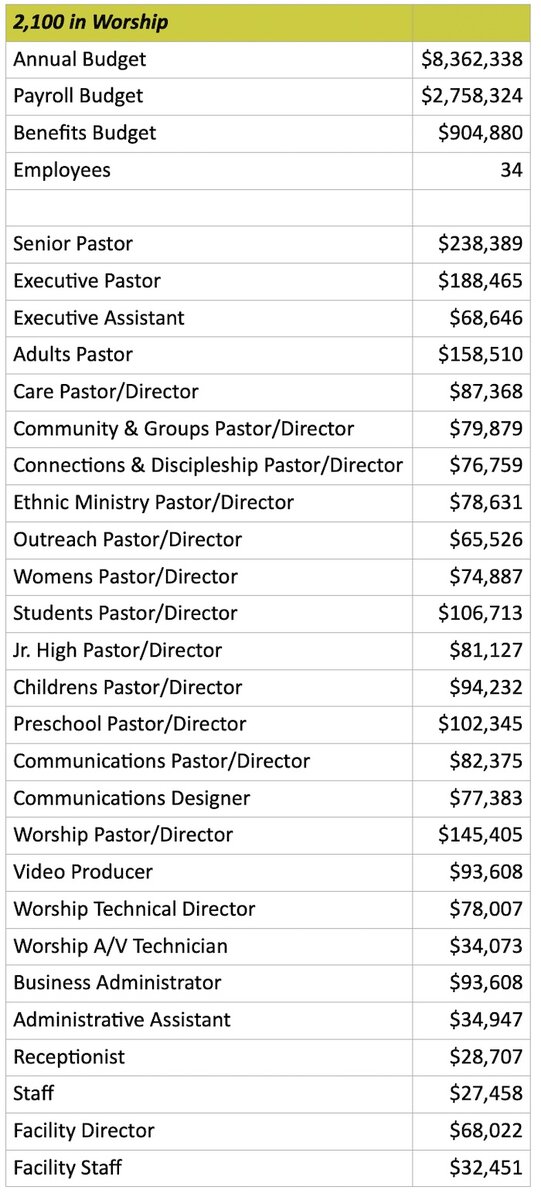
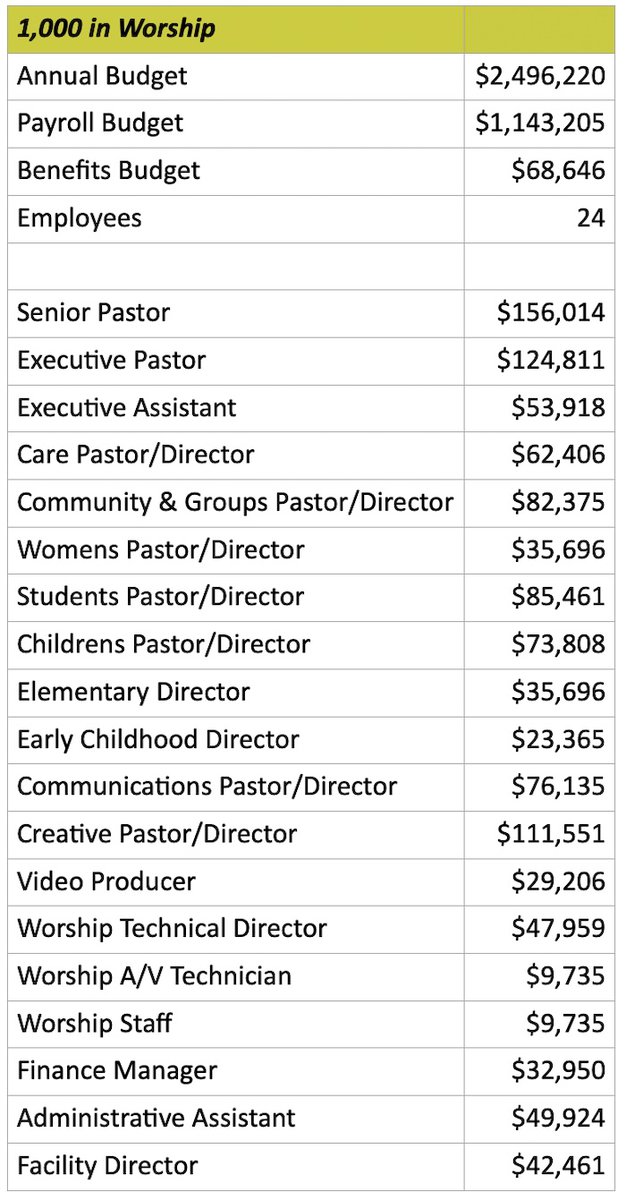
Samples of the Salary Forecaster
The Salary Forecaster has billions of dollars in data.
There are line items for over 31,000+ church employees.
See line item salaries from Senior Pastor to Facility Worker.
The data is forecast for the next year so that you can set where salaries should be.
This is ideal for creating budgets and setting fair compensation.
Four samples of the Salary Forecaster
One for each of the four census regions

Pivot Tables
The Forecaster has pivot tables.
Download the sheet to activate the pivot tables.
Pivot tables allow you to see just the roles or census areas that you want to see.

Bell Curve Charts
The Forecaster has bell curves for Pastors and Directors:
- Senior Pastor
- Executive Pastor
- Worship
- Campus
- Adults
- Students
- Communications
- Operations
- and more …
