What is data anyway? You don’t have to look far to find data. Megabytes in your cell phone plan. Visits and results in your electronic health record. Expenses and deposits in your bank account. Perhaps even on your wrist with tallied steps and heartbeats.
With its ubiquitous presence, it might seem that we all understand the term data—and by extension, its use and application in our daily life. But do we?
Data, as defined by the trusty dictionary.com, is individual facts, statistics or items of information. It’s all of the numbers and bits of input we receive from the world around us. When you think about it, it’s a lot—like, a lot.
So, how do we start to make sense of:
- What data matters most for your growing church?
- How you learn about that data?
- How do you make decisions based on it?
It Starts with a Pantry …
Think of various pieces of data for your church like canned goods in your pantry. Hang with us here. You’ve got green beans, breadcrumbs, cream of something and your favorite chips. There are lots of seemingly random things, but you usually know how to pull out and pair the items you need or want. Each item provides you with a different flavor or experience, and you can mix and match to create new things.
What pantry item (data) matters most depends on what you’re trying to create or the goal you’re trying to reach. Cereal is delicious, but not usually alongside a steak or featured in an intimate dinner for two.
The same is true for data. You might already have some numbers about church attendance or giving by guests, or maybe even some information about engagements with your ministries. Think of all those bits of data as pantry items ready to be combined together into something new and nourishing for your church.
- How do you know what numbers to focus on?
- Look at the end goal. Are you trying to grow attendance? Foster engagement?
Articulate the outcome you want, start with what data is available, and then get creating dots between the two.
… and a Teacher …
Before you can start connecting those dots, though, you have to have some amount of data literacy in your organization. You need someone who understands how to interpret the data and visualize it in a way that makes it actionable. Otherwise, you’ve got a panty of items that are either wasted or at the very least not operating at their full potential.
When you started learning your way around the kitchen, were you on your own, learning by trial, error and smoke alarms? Did you have a grandparent or sibling showing you the basics?
Whether you’re learning to meld pantry ingredients or figure out what event attendance means for your church’s goals, it’s helpful to have a guide to interpret the inputs and make the connection to where you want to go.
In our experience, the best teachers are described as inspiration meets expertise meets deep listening skills. They can take the ingredients, show you what they can do, then step out of the way to let you create.
… and Prayer
Cooking—and using data for church growth—both require discernment. There’s a fine balance of following a recipe or understanding the numbers, but also interpreting with finesse and growth through experimentation. There’s power in using specific measurements and data while also being guided by the still, small voice that encouraged you to make the move or grow your church in the first place.
We’ve heard it described as being data-informed and faith-driven. You need both to reap the abundance of the ministry you’re called to lead.
A Look Inside the Kitchen
In September of 2021, a multisite church with an average weekly attendance of 2,500 approached our team looking to find more meaning in their data. They were using RockRMS and collecting a lot of data points. But, they weren’t really doing anything with the data they were collecting.
The problem keeping them up at night was a recent decline in giving. The only metric they were looking at was total giving each week that was being manually recorded in Excel. While the data they were collecting was telling them something (giving was declining), it wasn’t enough to give them any clues as to why.
We took a look in their pantry to see what other various pieces of data they had available and got to work. We connected our tools directly to the RockRMS database and began building a recipe to get the insights the leaders were craving. The ingredients we chose to use were the following: household ID, date of gift, amount of gift, method of gift (credit card, check, cash, etc.), campus, fund, and head of household’s year of birth.
We combined the data points and visualized the results. Here’s what we discovered:
The number of households giving was consistent with just a small decline:

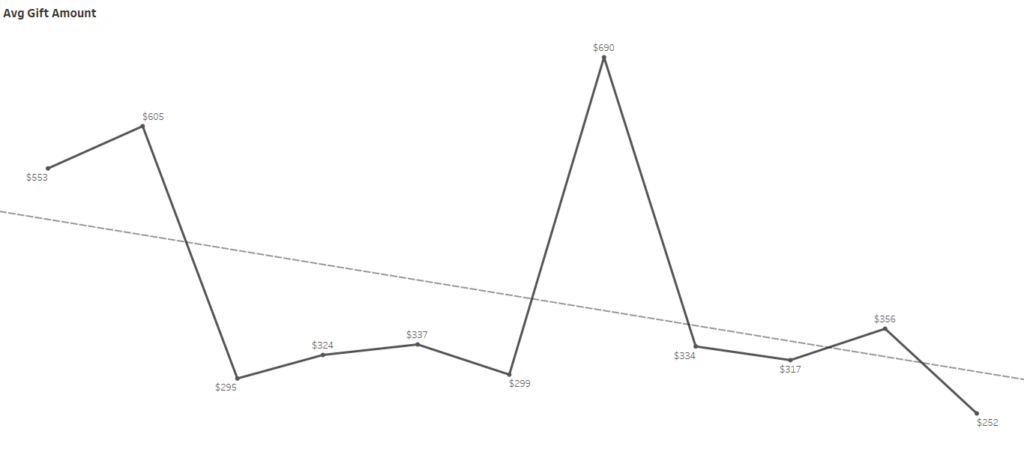
But, the average gift amount was down:
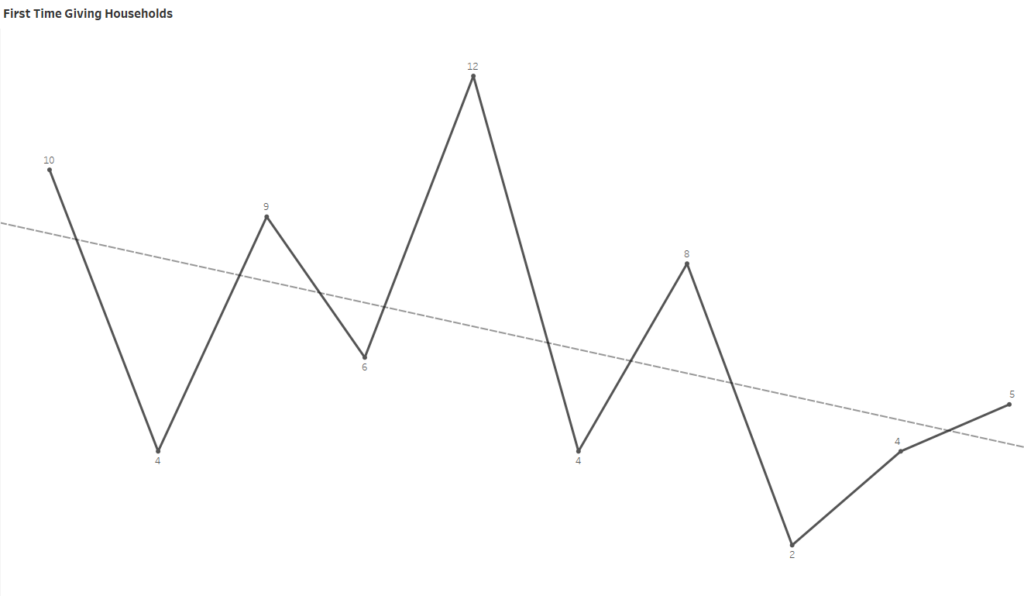
The number of new giving households was down:
Since we had the year the givers were born, we could see that GenX givers (1965-1980) were the only generation whose giving was trending up. The Boomer II generation (1955-1964) was declining the most:
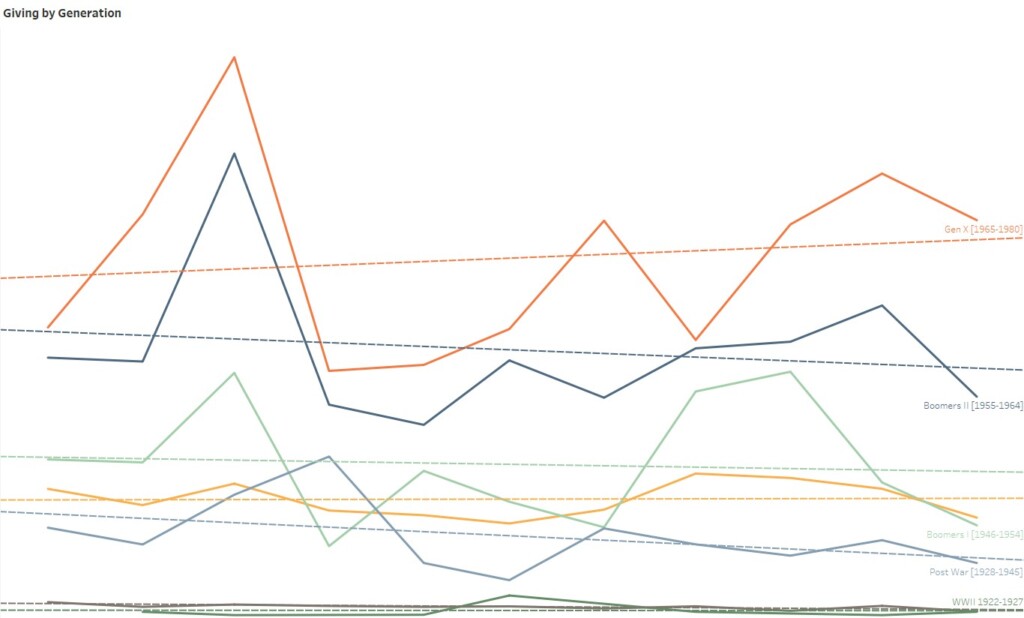
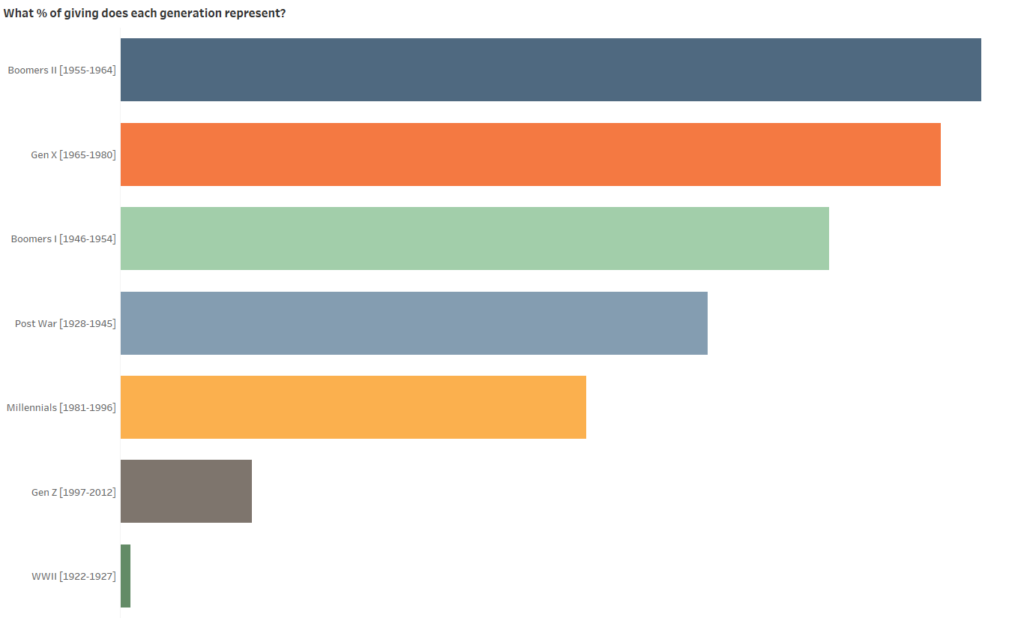
If I do my math correctly, The Boomer II generation would be anywhere between 58-67 years old. Many of these givers could be entering retirement! That might explain a few things! My next question was—what % of total giving households does this generation represent? The answer is 30%! That’s significant:
Conclusion
What do we do with this information? We continue to be curious. At this point we know the following:
- Giving is declining.
- The number of households giving is steady.
- The number of new households giving is declining so we aren’t gaining new givers.
- The largest segment of our givers is the Boomers II generation.
- The segment of our givers with the largest decline is the Boomers II generation.
The data isn’t going to tell you what to do but it will give you a starting place to begin facilitating conversations with your leadership team. Discoveries will emerge from the conversations.
As for this church, they created a Generosity Team and equipped them with actionable data. They began following up with new givers for the first time and reaching out to lapsed givers to only discover many ministry opportunities awaiting. It’s not about the money. It’s about using this data point to meet the needs of your guests. Every data point represents a person, and every person matters to God.
This is what it looks like to be a church that is data-informed and faith-driven. You need both to reap the abundance of the ministry you’re called to lead.


