
I often get emails that say: I’m in a high cost of living area. Should I be earning more because it costs more to live here? The question is a good one so let’s see what actual salary data indicates.
The World Population Review gives a cost of living index. Perplexity AI summarized their state indices into the four US census regions:
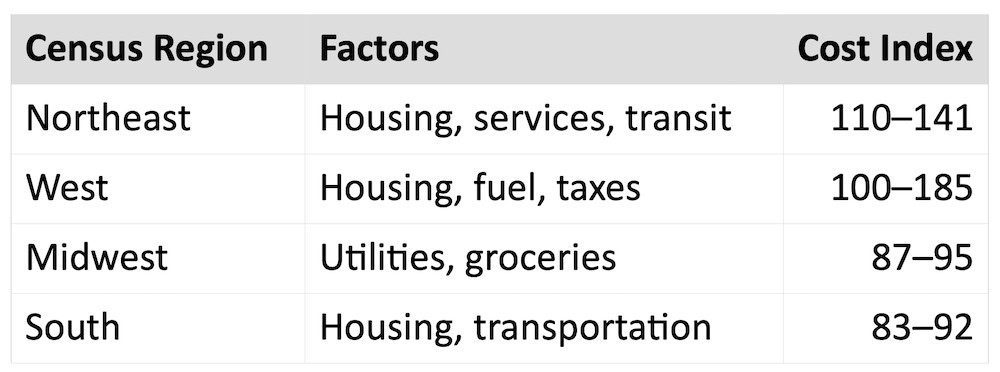
Differences in cost of living is mostly about expensive housing. A two bedroom apartment in New York state runs $1,659, in Kansas $995, in Mississippi $991 and in Hawaii $1,884. Urban areas are higher—that same-sized apartment in NYC is $5,874.
Based on cost of living, we expect church salaries in the Northeast and West to be 10-50% higher than the Midwest and South. Are salaries higher in real life?
Caution: Don’t shoot the messenger. I’m reporting to you salaries from XPastor’s Free Salary Forecaster with billions in church data.
Comparing Salaries Around the Nation
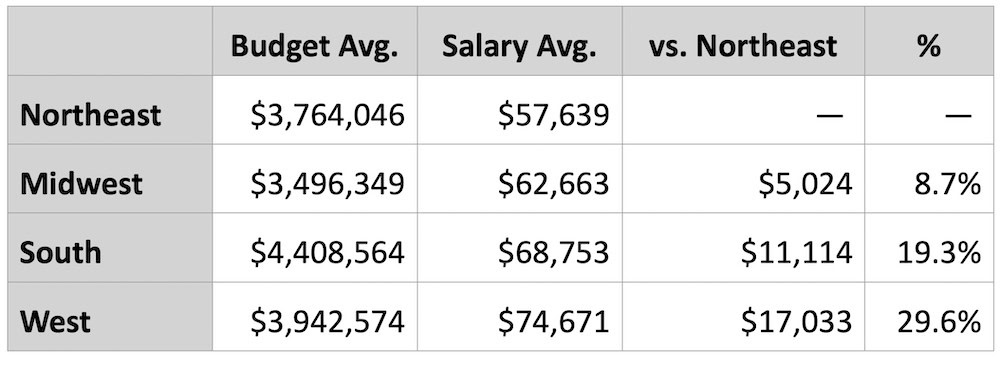
Let’s take the Northeast as a base for comparing salaries of churches with worship of 1,000 to 2,000 and budgets of $3.8 to $4.1 million. With cost of living considered, the South can pay well! The West often pays 2% to 14% more than the South, but comes with a 25-45% higher cost of living:

Childrens Pastor Example
Percentages can be hard to compare, so let’s look at data for the greatest increase—a Children’s Pastor:
Other positions, as seen previously, don’t increase nearly as much in the West. For example, Senior Pastor salaries can be lower in the West compared to the South.
Do the Math & Make a Bell Chart
When doing a Compensation Study, I create a Compensation Grid for all staff. Selected positions have standard deviation analytics and bell charts. Do the math to analytically prove various salary ranges:
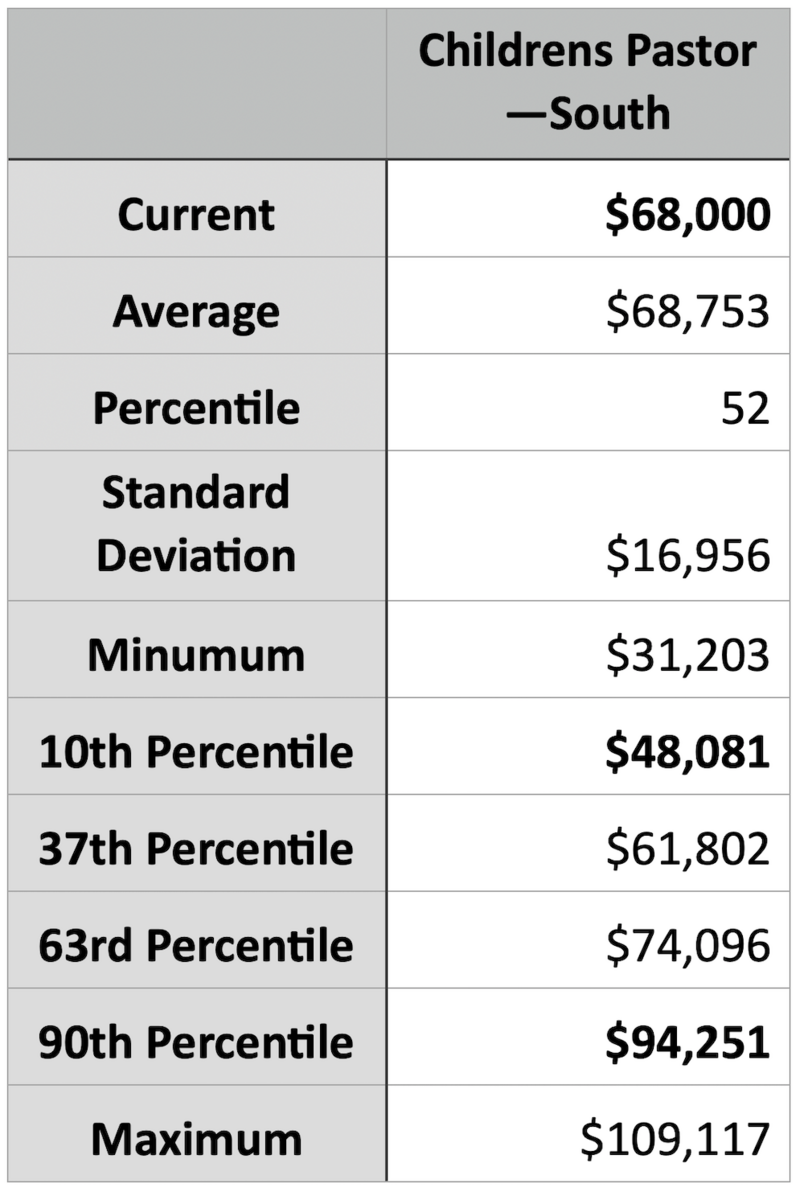
For the salary range use the 10th to 90th percentiles: $48,081 to $94,251.
So you can compare region, church size, salary and church budget, we list 50-100 data points in the appendix to our Compensation Studies. Each dot in the bell chart is a specific salary:
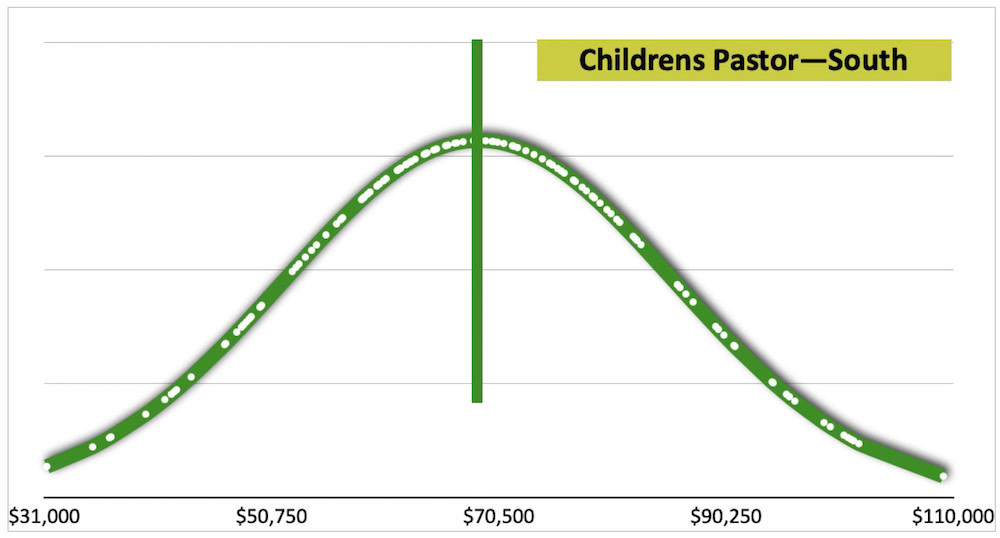
Many have a hard time understanding the analytics table. The bell chart gives a graphic way of seeing ranges, with a line showing the current salary. Always create bell charts for selected positions.
Key Points
Here are some things to remember about compensation.
- Some church salaries in high cost of living areas pay better. Unfortunately for many positions, it’s not as much as you might hope. In the lowest cost of living region, the South often pays better. To pay for housing in high cost of living areas, many married staff must be two-income families.
- The biggest determinate of salary is general fund budget. This is followed by the church’s generosity ethos.
- Look at your community’s teacher and administrative salaries to help determine fair pay. Study the MIT Living Wage Calculator for your city or county.
Salaries and benefits are 54.4% of most churches budgets. It is a complex mix of understanding local cost of living, sorting out tiers of personnel (pastor, exempt and non-exempt), and keeping up with inflation. XPastor’s Free Salary Forecaster with billions in church data can give you solid data points to consider.
I’ve been doing compensation analyses since 2005 and still get surprised by the numbers. To study your compensation, you will need to devote a lot of time and effort!
You can do an analysis on your own. Some prefer to get an objective Compensation Study with bell charts, analytics, 50-100 specific salaries and a compensation grid for the entire staff.